Alt text author guidelines
Introduction
What is alt text?
- Alt text (alternative text) is a short description of an image that describes the content of the image.
- The alt text is embedded within the images in our digital formats and can be read by screen readers, therefore making our content fully accessible to those readers with visual impairments.
Why is alt text important?
Alt text is a key part of accessible publishing, and a requirement of the European Accessibility Act. At UCL Press we are committed to making our content as accessible as possible to all readers. In line with our open access mission, we aim to provide inclusive publishing and to reach the widest possible audiences.
Why do we ask our authors to provide the alt text?
- As the author, you are in the best position to provide clear, descriptive text because you are the subject-matter expert. You have sourced the image and understand best which details from the image are important to convey, based on the context in which it has been used.
- You maintain creative control of alt text creation and output rather than handing it to an external alt text creator. It becomes another part of the book or article submission, alongside the manuscript and artwork.
When is alt text needed?
- Alt text is required for any figure in your book or article that conveys meaning in your text. This includes descriptive images (conveying important information or context), functional images (serving a function, like web links), informative images (adding additional information that is not in the text) and complex images (maps, graphs and diagrams).
- Alt text is not required for tables, text boxes, or cover images..
Why should authors provide alt text?
- As the author, you are in the best position to provide clear, descriptive text because you are the subject-matter expert; you have sourced the image and know your content best.
- You maintain creative control of alt text creation and output rather than handing it to an external alt text creator. It becomes another part of the book or article submission, alongside the manuscript and artwork.
How does alt text differ from captions?
A caption gives context to the image and often includes a source/copyright note. It can be read by a screen reader in the same way as main body text.
Alt text is a description of the image which is read aloud by a screen reader so that the image itself can be understood. Without alt text, the image is skipped by the screen reader.
Alt text will typically be more descriptive than a caption. However, in some circumstances the caption may be sufficiently descriptive. In these instances, there is no need to provide alt text in addition to the caption.
How should I submit my alt text?
Please submit in the column provided in the ‘Artwork and permissions’ spreadsheet, alongside your caption information.
How to write alt text
- Provide alt text only if necessary: if the main body of the text, or the figure caption, sufficiently describes the image, there is no need to provide alt text. In these instances, please state that alt text is not required on submission of your final manuscript.
- Context is key: There is no ‘one size fits all’ description of images, this is especially true of photographs. Different aspects of the image will be relevant depending on the context in which the image has been used. Always consider why you have included the image and what it was chosen to portray – this will be the most helpful starting point for writing your alt text.
- Length: please keep alt text descriptions to c. 50 words per item – always more than 10 words, and less than 100. For simple pictures, one or two sentences should be sufficient, more complex images and diagrams may need up to four or five sentences of alt text. Always use complete sentences.
- Diagrammatic or graphical images: in these instances, describe the figure in general terms to give the reader a framework for its inclusion, and then outline the most important information that it contributes to its context.
- Complex figures such as charts or maps: depending on the context in which these are used, charts and maps may need a more detailed description or dataset, in addition to the alt text (this is known as a ‘long description’). See ‘Long description’ section.
- Be precise: describe the image in plain language. There is no need to repeat the figure caption. Alt text focuses more on the specific details of the figure than provided in the caption, where this further detail is relevant to understanding and context.
- Go straight into the description: you do not need to say ‘in this photograph’, ‘in this figure’. However, introducing specific graph types can be useful: ‘A pie chart showing …’ or introducing the type of art: ‘This impressionistic painting conveys…’
- Be neutral: avoid words that convey a subjective judgement, ie: ‘an ugly building’, in favour of neutral descriptors.
- Race, ethnicity, sex, race and gender: only reference race, ethnicity, sex, gender or age where this is relevant to the context of the image and what it has been chosen to portray.
- Style: please follow the style used in your main text. For example, if you have used ‘ise’ spelling and UK spelling in your book, the alt text should follow same approach.
- Punctuation: punctuation within an alt text description should be kept as simple as possible. Ideally use only commas, full stops, exclamation marks and question marks. Some screen readers may not recognise or announce more complex punctuation marks such as hyphens, parentheses or quotation marks. Do not use bullet points in alt text.
- Symbols: use only standard symbols (ie, £ $ @ / ? %). Other symbols should be spelled in full to ensure they are correctly read by the screen reader.
- Bold/italics: do not use in alt text as it is not recognised by screen readers.
- Contractions and abbreviations: Please spell out abbreviations and avoid contractions in alt text.
Long Descriptions
A long description is a more complex description that is required if the image provides information that is not present in the text. More detailed images, in particular graphs, diagrams and charts are likely to require long descriptions. In contrast to alt text, long descriptions may contain lists, bullet points and data tables. They are always provided in addition to the alt text. A useful site covering this in more detail can be found here: http://diagramcenter.org/table-of-contents-2.html Below is an example of alt text and a suitable long description for a line graph. Note that the long description uses a table to present the data in succinct form and is often the easiest way to summarise complex information from graphs and pie charts
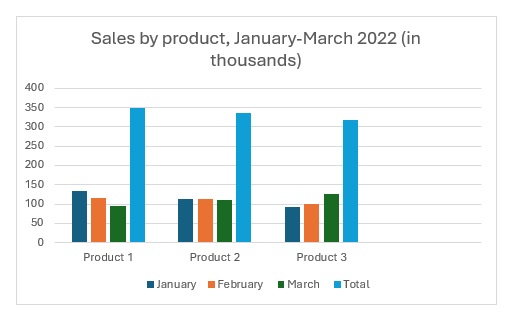
Alt text: The bar chart shows the sales for each product for January to March 2022. Product 1 had the greatest total number of sales although sales decreased over the quarter. Product 2 had consistent sales throughout the quarter, while product 3 sales increased month on month despite having the lowest sales overall.
Long description: The chart shows the number of sales by product for January to March 2022, detailing the sales per month for each product, and the total sales per product over the three month period.
Numerical values presented in the chart:
| Period | Product 1 | Product 2 | Product 3 |
|---|---|---|---|
| January | 135 | 112 | 92 |
| February | 117 | 114 | 99 |
| March | 96 | 111 | 126 |
| Total | 348 | 337 | 317 |
Examples of alt text
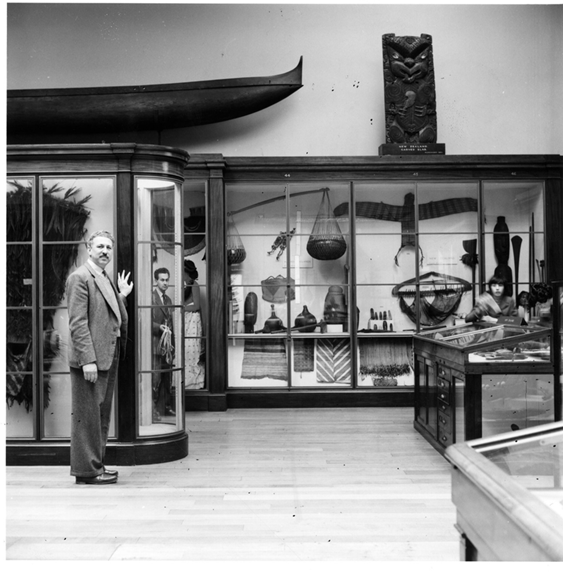
Figure 2.1
Caption: Part of the Oceania section of the British Museum ethnography galleries in 1968. Source: © The Trustees of the British Museum. Shared under a Creative Commons Attribution-NonCommercial-ShareAlike 4.0 International (CC BY-NC-SA 4.0) licence.
Alt text: A man at the British Museum ethnography gallery is standing beside a glass display case containing various cultural artefacts. Another glass display case lines the wall behind, containing woven baskets, pottery and textiles. A wooden canoe and a carved wooden artefact are placed above the case.
Why this works: the alt text is distinct from the caption, no longer than 50 words, and contains three descriptive complete sentences, focusing first on general description and the second and third honing in on other relevant details in the image. There is no unnecessary introduction: i.e., ‘In this photograph’.
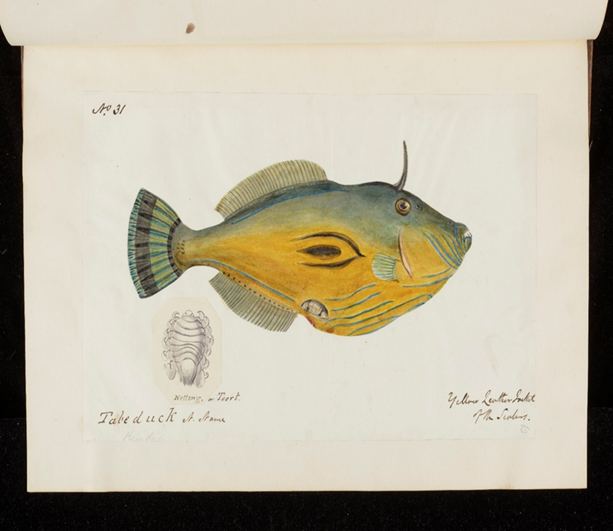
Figure 11.4
Caption: Sketch of the fish Tabaduck in Neill’s portfolio. Source: Natural History Museum.
Alt text: A sketch of a Tabaduck fish with a horn-like projection on its head. It has a tail fin, dorsal fin, anal fin and tiny pectoral fins on either side. A small, detailed drawing highlights the fish’s intricate scale pattern, showcasing its diverse adaptations.
Why this works: under 50 words, complete sentences moving from general overview of image to more detail. The description is distinct from information in caption. Use of word ‘a sketch’ is relevant here to depict the type of artwork.
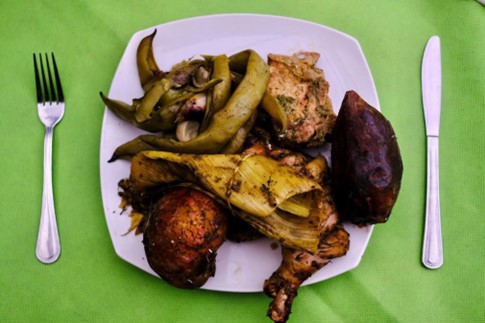
Figure 2.8
Caption: Chicken prepared in a pachamanca (‘pot in the earth’) at the Peruvian Club. Source: photo by Alfonso Otaegui.
Alt text: A plate of food including cooked chicken and vegetables with a fork and knife laid either side of the plate on a green tray.
Why this works. Caption and alt text are distinct; alt text is kept short and to the point. The alt text provides the reader with a more vivid description of the plate of food than is provided in the caption.
Fine Art
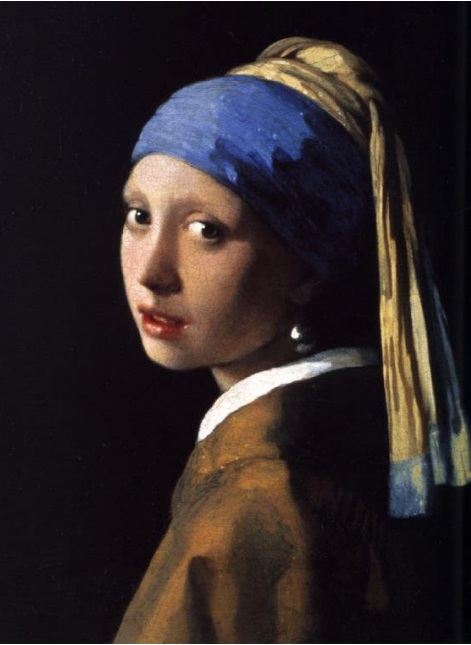
Figure 3.4
Caption: Johannes Vermeer, Girl with a Pearl Earring, 1665. Oil on canvas,
44.5 x 39 cm. Collection of the Mauritshaus, The Hague. Source: public domain.
Alt text: A young woman tilts her head over her shoulder, gazing towards the viewer with her lips slightly parted. A turban covers her hair, leaving only the bottom half of her ear on show, adorned with a large pearl exposed. Her turban is blue and gold. She is wearing a white shirt under a brown jacket.
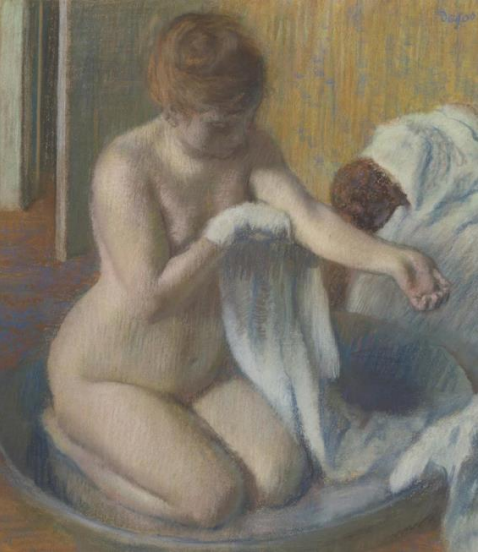
Figure 3.5
Caption: ‘Woman in a Tub’ by Edgar Degas, c. 1883. Wikimedia Commons. Source: Public domain.
Alt text: Edgar Degas’s artwork, Woman in a tub, circa 1883, presented in pastel on paper. The portrait features a nude woman kneeling in a shallow, circular bathtub.
She holds a white towel in her right hand. A second towel lies draped across a dark red armchair to her left. A pale green door stands open in the background, framed by yellow wallpaper.
Graphs/diagrams
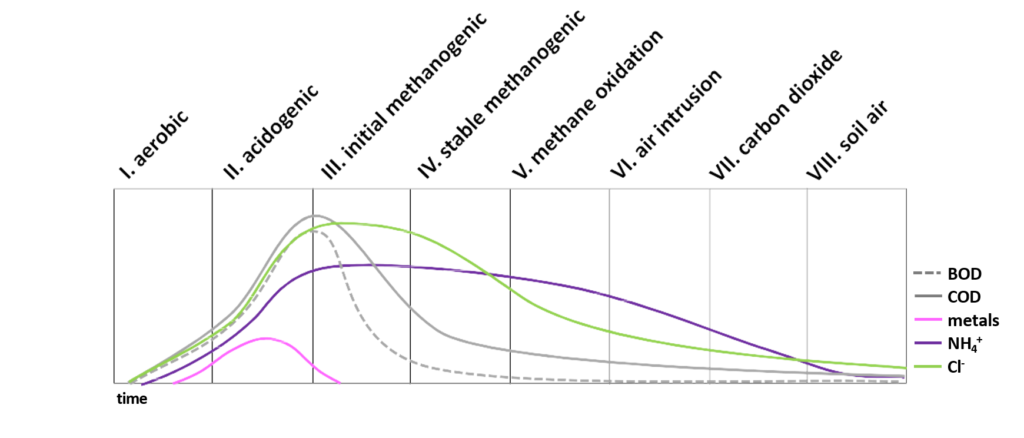
Figure 8.2
Caption: Landfill leachate composition predictions as a function of time. Source: Adapted from Kjeldsen et al (2002).
Alt text: The line chart compares the lifetime of a landfill showing general trends in gas and leachate quality development over time.
Long description: Time is plotted along the X-axis, but no measurements are provided. Time is divided into eight sections as follows:
- Aerobic
- Acidogenic
- Initial methanogenic
- Stable methanogenic
- Methane oxidation
- Air intrusion
- Carbon dioxide
- Soil air.
Five data lines represent the trends in gas and leachate quality. These include biological oxygen demand, chemical oxygen demand, heavy metals, ammonium ion and chloride.
The percentages are plotted against the Y-axis, but no measurements are provided. The full dataset is presented in the following table. Please note that the data are estimated for each stage of decomposition.
| Stage | Biological oxygen demand | Chemical oxygen demand | Heavy Metals | Ammonium ion | Chloride |
|---|---|---|---|---|---|
| Aerobic | Rises from 0 to 20 | Rises from 0 to 25 | Rises from 0 to 10 | Rises from 0 to 10 | Rises from 0 to 20 |
| Acidogenic | Rises from 20 to 80 | Rises from 25 to 85 | Rises from 10 to 20 and falls to 8 | Rises from 10 to 60 | Rises from 20 to 80 |
| Initial methanogenic | Falls from 80 to 0 | Falls from 85 to 40 | Falls from 8 to 0 | Stays at 60 | Rises to 83 and falls to 80 |
| Stable methanogenic | Falls from 10 to 3 | Falls from 40 to 15 | 0 | Falls from 60 to 55 | Falls from 80 to 50 |
| Methane oxidation | Falls from 3 to 1 | Falls from 15 to 8 | 0 | Falls from 55 to 45 | Falls from 50 to 25 |
| Air intrusion | Falls from 1 to 0 | Falls from 8 to 5 | 0 | Falls from 45 to 25 | Falls from 25 to 15 |
| Carbon Dioxide | 0 | Falls from 5 to 3 | 0 | Falls from 25 to 8 | Falls from 15 to 8 |
| Soil air | 0 | Falls from 3 to 2 | 0 | Falls from 8 to 2 | Falls from 8 to 5 |
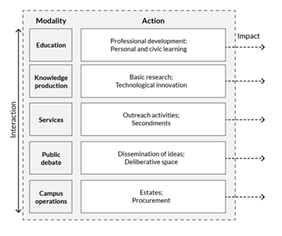
Caption: University modalities.
Alt text: A diagram visualises the 5 university modalities.
Long Description: The diagram presents the university as a dashed line rectangle. Within the rectangle, the 5 university modalities are presented as 5 stacked boxes on the left side of the diagram. A vertical two-way arrow is labelled, Interaction, and represents the interaction between the modalities.
The actions are presented as 5 stacked boxes related to each modality. The impacts of each modality and action are presented as left to right arrows leading out of the dashed line rectangle to the right. The details of the modalities and actions are as follows.
- Modality 1. Education. The actions are as follows.
- Professional development.
- Personal and civic learning.
- Modality 2. Knowledge production. The actions are as follows.
- Basic research.
- Technological innovation.
- Modality 3. Services. The actions are as follows.
- Outreach activities.
- Secondments.
- Modality 4. Public debate. The actions are as follows.
- Dissemination of ideas.
- Deliberative space.
- Modality 5. Campus operations. The actions are as follows.
- Estates.
- Procurement.
Resources
- What is alt text?
- Introduction to alternative text
- Describing figures
- Image descriptions
- Image description guidelines
- The alt decision tree
- Image alt text best practices
- textBOX image description examples
- Images tutorial
- Webinars on accessible publishing and reading
Last updated: 23rd July 2025